AWS Cost Spikes: Causes and Fixes
A deep dive into the real reasons AWS costs spike unexpectedly and how to detect them before they hit your invoice.
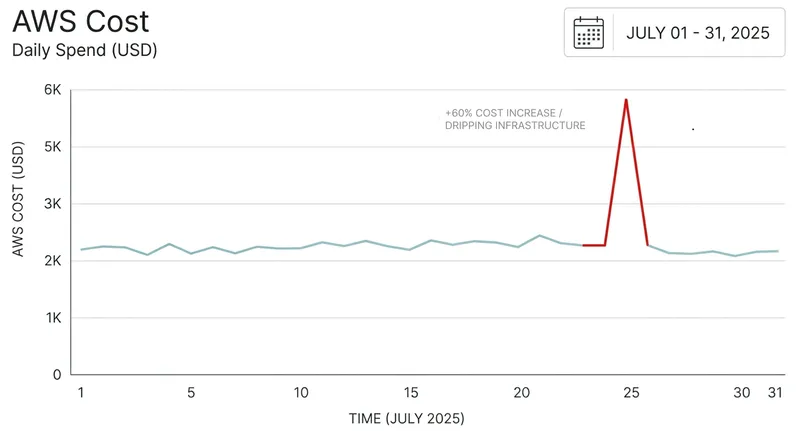
AWS cost spikes rarely feel like a warning—they feel like a surprise.
One day everything looks normal. Next, your spend jumps 30–200% with no clear explanation, and teams scramble through dashboards trying to figure out what changed.
The real problem isn’t the spike itself. It’s the lack of immediate clarity:
- - What changed?
- - Who triggered it?
- - Is it valid growth or wasted spend?
By the time answers come together, the damage is already done.
Most teams don’t struggle with cloud costs because they lack data. They struggle because they lack context, ownership, and real-time causality when it matters most.
In this blog, you’ll learn the most common reasons AWS costs suddenly spike — from idle resources and autoscaling misconfigurations to hidden data transfer charges and runaway workloads. More importantly, you’ll learn how to detect these issues early using simple monitoring signals and guardrails, so you can catch cost problems before they turn into unexpected bills.
Before we break it down, here’s a quick overview of what we’ll cover:
- Idle resources that quietly keep running
- Autoscaling misconfigurations causing uncontrolled growth
- Data transfer costs that often go unnoticed
- GPU and high-cost instance usage
- Storage growth from logs, snapshots, and backups
- Bugs and retry loops generating excess usage
- Over-provisioned compute resources
- Hidden structural issues that amplify cost
- How to catch AWS cost spikes early
- Final thought
1. Idle Resources That Never Got Cleaned Up
Idle resources often start as harmless experiments. Engineers spin up infrastructure for testing, debugging, or short-term workloads, fully intending to clean them up later. But in fast-moving environments, these resources are frequently forgotten and continue running quietly in the background. Over time, they accumulate cost without contributing real value, making them one of the most common sources of unexpected AWS spend.
Here’s a quick summary of the key takeaways.
Why it happens
Engineers spin up resources for testing, debugging, or temporary workloads and forget to shut them down.
Example
EC2 instances left running after testing, unattached EBS volumes, or idle load balancers.
How to detect it early
Track low CPU utilization (<5%), identify unattached storage, and run weekly cleanup audits.
2. Autoscaling Misconfigurations Causing Uncontrolled Growth
Autoscaling is designed to handle traffic spikes smoothly, but when it’s misconfigured, it can quietly do the opposite. A small burst of traffic, a retry loop, or a misinterpreted metric can trigger aggressive scaling. Without proper limits in place, the system keeps adding instances faster than expected. What starts as a normal scaling response can quickly turn into uncontrolled growth, with costs rising in the background and no obvious warning.
Why it happens
Autoscaling thresholds are too sensitive, or max limits are undefined, causing systems to scale endlessly under sustained or abnormal load.
Example
A traffic spike triggers scaling, but without a max cap, instance count keeps increasing. Retry loops or noisy metrics amplify the effect.
How to detect it early
Monitor instance count trends, enforce strict upper limits on autoscaling groups, and alert on sudden or repeated scaling events.
3. Data Transfer Costs That Often Go Unnoticed
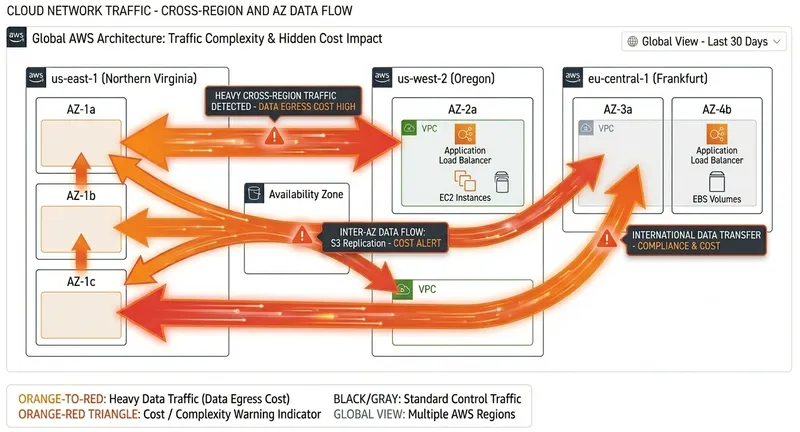
Data transfer is one of the most underestimated AWS cost drivers because it rarely appears as a single obvious spike. Instead, it builds gradually as services communicate across availability zones, regions, and the public internet. Systems still look healthy, so there’s no immediate alert — but the cost keeps accumulating as traffic patterns grow and architectures become more distributed.
Here’s a quick summary of the key takeaways.
Why it happens
Cross-AZ and cross-region communication, external API calls, and large outbound traffic flows generate transfer charges that are easy to miss.
Example
Services communicating across availability zones, high-volume API responses to external clients, or frequent cross-region S3 data movement.
How to detect it early
Track “Data Transfer Out” metrics, break down costs by region and AZ, and enable detailed billing reports to uncover hidden traffic patterns.
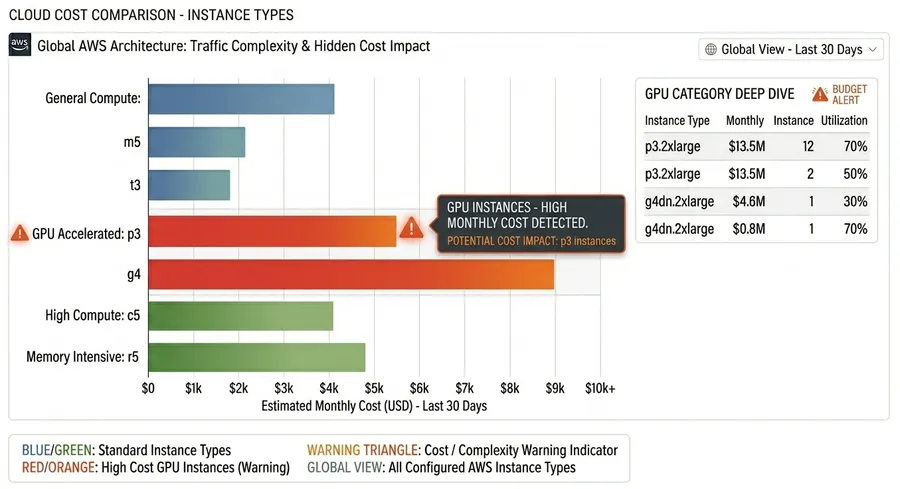
4. GPU and High-Cost Instance Usage
GPU and high-performance instances are essential for compute-heavy workloads like machine learning, data processing, and rendering, but they come at a premium. The issue usually isn’t provisioning them — it’s leaving them running after workloads finish. In many cases, environments created for experimentation or training stay active longer than needed, silently accumulating cost.
Why it happens
GPU and high-memory instances are provisioned for intensive workloads but not shut down promptly after job completion, especially in dev or research environments.
Example
ML training jobs finish, but GPU instances remain running; notebook environments stay active overnight without active computation.
How to detect it early
Monitor cost and usage by instance type, alert on GPU runtime spikes, and auto-stop idle resources after inactivity thresholds.
5. Storage Growth from Logs, Snapshots, and Backups
Storage costs often grow silently because they’re tied to systems that continuously generate data in the background. Logs, snapshots, and backups accumulate over time without direct user interaction, so growth is easy to miss until it becomes significant. Without lifecycle policies, this expansion continues indefinitely.
Why it happens
Continuous logging, automated backups, and snapshot policies without retention limits.
Example
S3 logs accumulating without lifecycle rules, expanding EBS snapshots, or unused backup archives.
How to detect it early
Monitor storage growth trends, enforce lifecycle policies, and review snapshot retention schedules regularly.
6. Bugs and Retry Loops Generating Excess Usage
Not all cost spikes come from infrastructure changes — some come from application behavior. Bugs such as infinite retry loops, aggressive polling, or misconfigured schedules can dramatically increase request volume without obvious functional impact. These issues are risky because systems may appear healthy while quietly consuming far more resources.
Why it happens
Application logic errors trigger repeated API calls or background jobs that unintentionally scale usage.
Example
Infinite retry loops, high-frequency polling services, or cron jobs running more often than intended.
How to detect it early
Monitor request rates, queue depth, and API call spikes; configure anomaly alerts for unusual usage patterns.
7. Over-Provisioned Compute Resources
Over-provisioning happens when systems are allocated more compute capacity than they need. Teams often do this to avoid performance risk, but it leads to persistently underutilized resources that still incur full cost. Over time, this creates a baseline of waste across environments.
Why it happens
Conservative provisioning decisions lead to consistently underutilized compute resources.
Example
Large EC2 instances running at low CPU usage or Kubernetes nodes over-allocated for stable workloads.
How to detect it early
Track CPU and memory utilization trends, then right-size instances based on actual workload patterns.
8. Hidden Structural Issues That Amplify Cost
Cloud cost problems are rarely caused by one resource or one spike. They usually come from structural gaps that compound over time and make budgets unpredictable.
Missing or Weak Cost Allocation Tagging
- Resources running without clear ownership tags
- Shared environments where usage cannot be traced
- Cost visibility breaking down across teams and projects
Lack of Cost Monitoring
- Budgets reviewed after spend occurs instead of during usage
- No anomaly detection for sudden usage spikes
- Alerts arriving too late to prevent overspend
9. How to Catch AWS Cost Spikes Early
Most AWS cost spikes don’t happen instantly — they build over hours or days. The goal is not just faster response, but earlier detection before the bill reflects the damage.
- Track anomalies daily instead of relying on monthly reporting cycles.
- Monitor sudden changes in service-level usage (EC2, S3, Lambda), not just total spend.
- Set alerts on unusual behavior patterns, not only static thresholds.
- Use rolling baselines (7–14 days) to detect abnormal behavior against normal trends.
- Correlate deployments with cost changes to quickly identify faulty releases or misconfigurations.
10. Final Thought
Cloud cost spikes are rarely random. They are usually the result of small inefficiencies compounding over time: idle resources, misconfigured scaling, unnoticed usage patterns, and weak visibility across services.
- Most teams notice the issue only after the bill arrives, when it’s already too late to prevent waste.
- The real advantage comes from detecting anomalies as they form, not after they peak.
- Continuous visibility across services is what separates controlled spend from uncontrolled growth.
If you’re trying to reduce noise and catch cost issues early, tools like CloudVectra can bring anomaly detection, visibility, and automation into one workflow, so teams don’t have to rely on manual reviews.
Want to prevent AWS cost spikes?
Get visibility into cost spikes, idle resources, and anomalies before they hit your bill.